
So you have finally written and deployed your first microservice? Or maybe you have decided to embark on the microservices adventure to future proof yourself? Either way, Congratulations!!!
It’s time to take the next step. Its time to set up monitoring!
Why setting up monitoring is important?
Monitoring is super important. It is that part of your system that lets you know what’s going on in your app.
And it isn’t just a dashboard with fancy charts.
Monitoring is the systematic process of aggregating actionable metrics and logs.
The keyword here is actionable.
You are collecting all these metrics and logs to take decisions based on it.
For example, you would want to collect the health of your VMs & microservices to ensure you have enough healthy capacity to service user requests. You’d also like to trigger emails & notifications in case failures go below a certain threshold.
This is what monitoring helps you achieve. This is why you need to set up monitoring.
As its clearly evident, your monitoring stack is a source from which several processes can be automated. So its really important to make sure your monitoring stack is reliable and that it can scale with your application.
Prometheus has become the go-to monitoring stack in recent times.
It’s novel pull-based architecture, along with in-built support for alerting, makes it an ideal choice for a wide variety of workloads.
In this article, we’ll use Prometheus to setup up monitoring. For visualisations, we’ll use Grafana.
This guide is available in video format as well. Feel free to refer to it.
I’ve set up a GitHub repository for you guys as well. Use it to reproduce everything we’ll be doing today.
What is Prometheus and Grafana?
Prometheus is a metrics aggregator.
Instead of your services pushing metrics to it, like in the case of a database, Prometheus pulls metrics from your services.
It expects services to make an endpoint exposing all the metrics in a particular format. All we need to do now is tell Prometheus the address of such services, and it will begin scraping them periodically.
Prometheus then stores these metrics for a configured duration and makes them available for querying. It pretty much acts like a time-series database in that regard.
Along with that, Prometheus has got first-class support for alerting using AlertManager. With AlertManager, you can send notifications via Slack, email, PagerDuty and tons of other mediums when certain triggers go off.
All of this makes it super easy to set up monitoring using Prometheus.
While Prometheus and AlertManager provided a well-rounded monitoring solution, we need dashboards to visualise what’s going on within our cluster. That’s where Grafana comes in.
Grafana is a fantastic tool that can create outstanding visualisation.
Grafana itself can’t store data. But you can hook it up to various sources to pull metrics from including Prometheus.
So the way it works is, we use an aggregator like Prometheus to scrap all the metrics. Then we link Grafana to it to visualise the data in the form of dashboards.
Easy!
What we’ll be monitoring?
Microservices
We’ll be monitoring two microservices today.
The first microservices is written by a math genius to perform insane calculations. By insane calculations, I mean adding two numbers.
It’s a simple HTTP endpoint expecting two numbers in the request and responds back with the addition of those two numbers.
The second one is a polite greeter service that takes a name as a URL parameter and responds with a greeting.
Here’s what the endpoints look like:
| Service | URL | Response |
|---|---|---|
| Math Service | /add/:num1/:num2 |
{ "value": SUM_OF_NUMBERS } |
| Greeter Service | /greeting/:name |
{ "greeting": "hello NAME" } |
And here’s the link to the code:
- Math Service - Written in Node.js
- Greeter Service - Written in Golang
Both these services will be running inside Docker. Neither one of them have any code related to monitoring whatsoever. In fact, they don’t even know that they are being monitored.
Wait that doesn’t sound right.
Metrics
We will be monitoring a couple of metrics. This is what the final dashboard will look like.
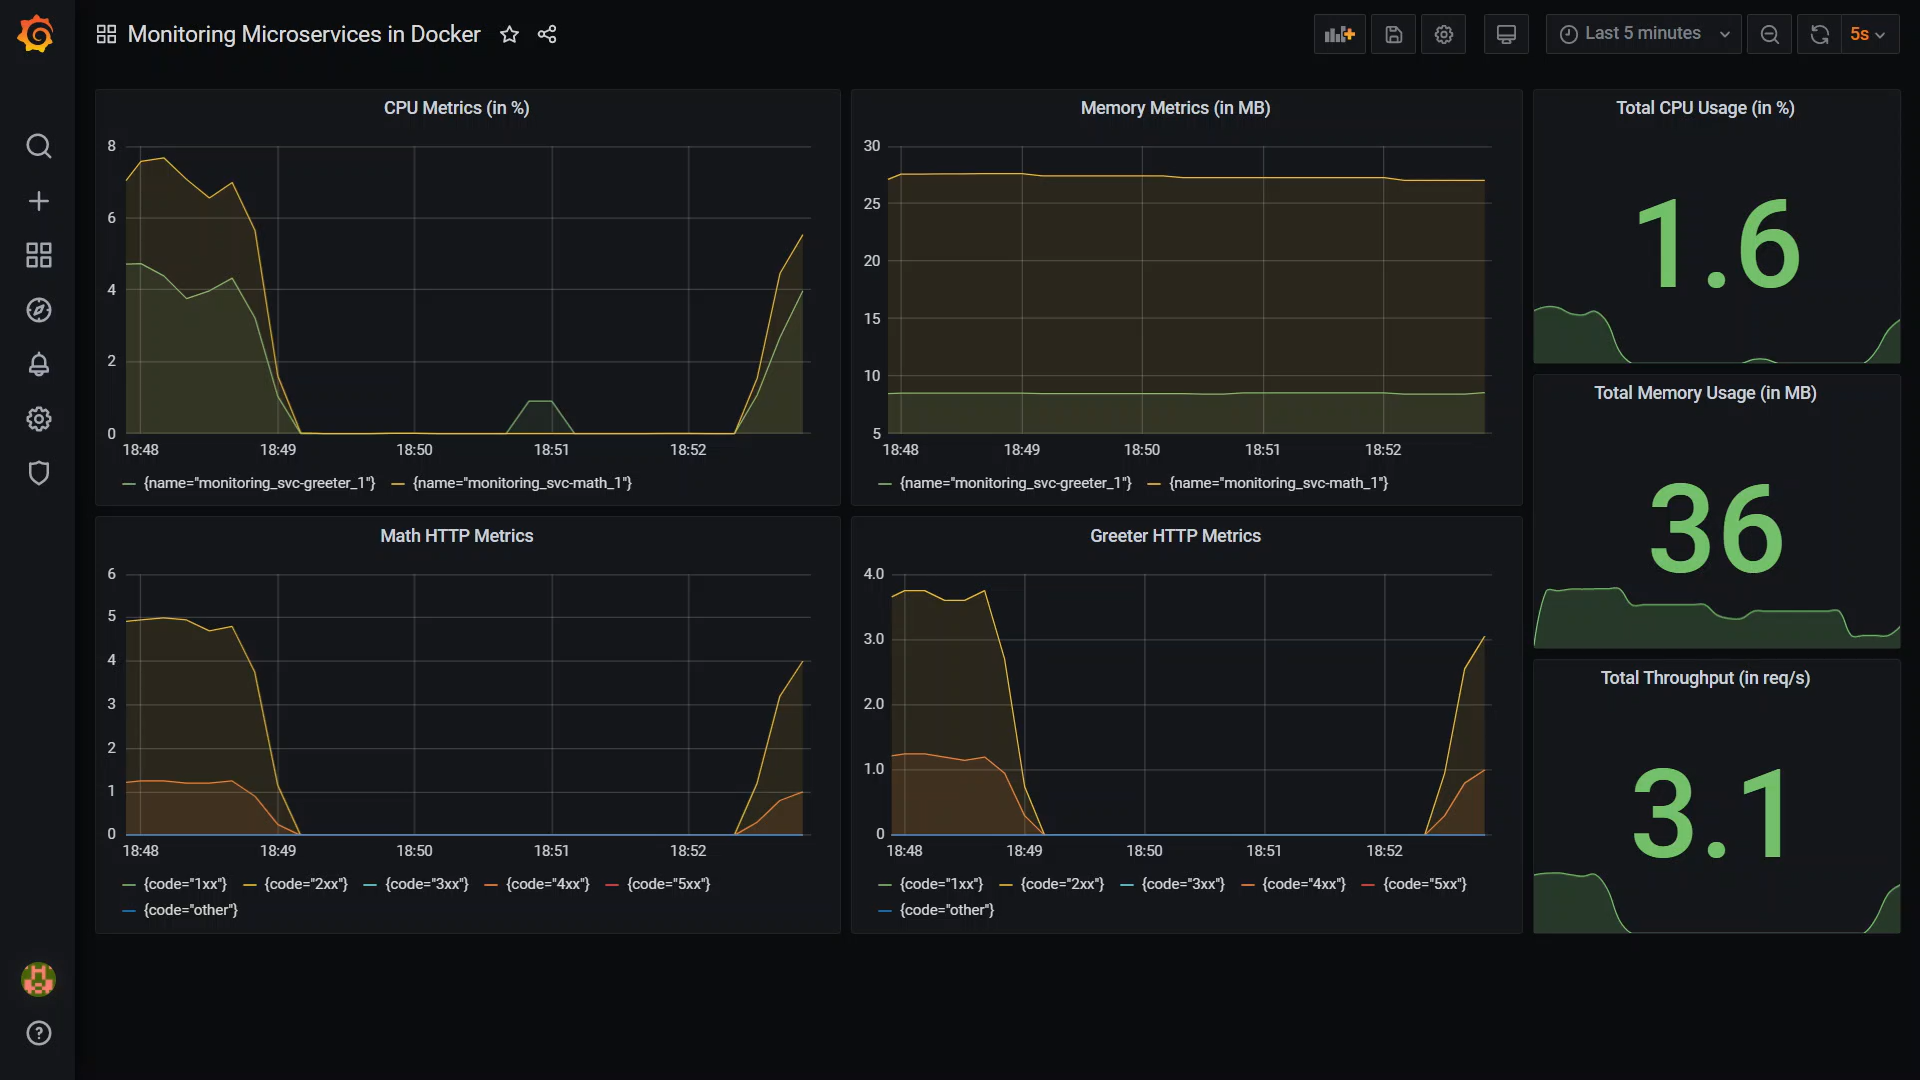
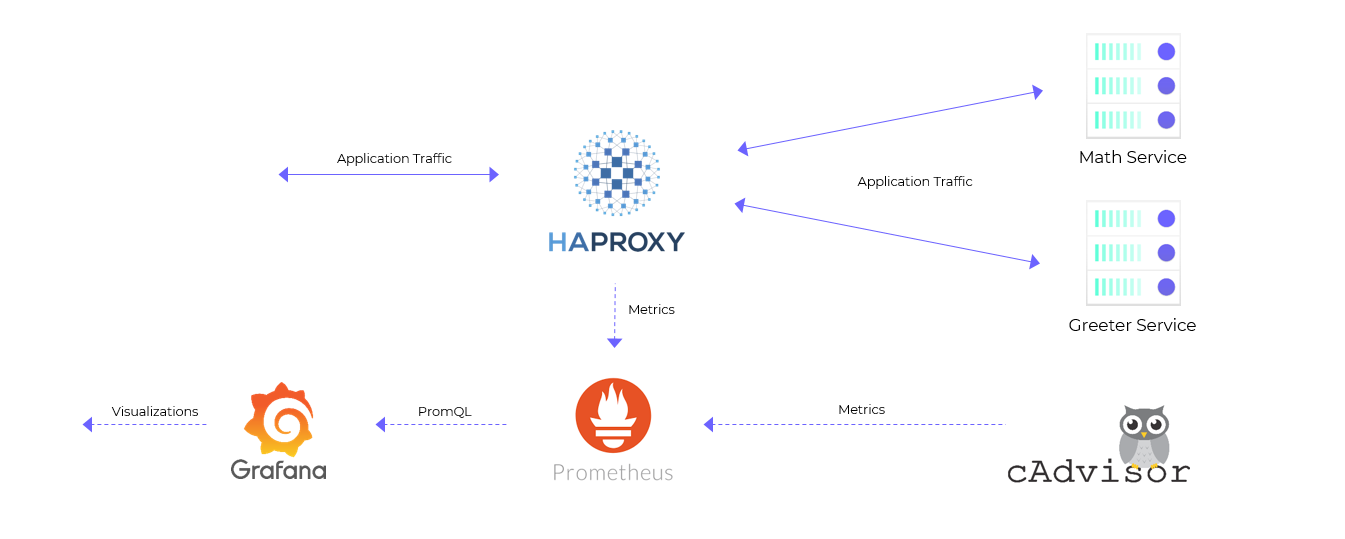
First is the CPU & memory utilisation of our services. Since all our services will be running in Docker, we’ll use cAdvisor to collect these metrics.
cAdvisor is a really neat tool. It collects container metrics directly from the host and makes it available for Prometheus to scrape. You don’t really need to configure anything for it to work.
We’ll also be collecting HTTP metrics. These are also called l7 metrics.
What we are interested in is the requests coming in per second grouped by response status code. Using this metric alone, we can infer the error rates and total throughput of each service.
Now we could modify our services to collect these metrics and make them available for Prometheus to scrape. But that sounds like a lot of work. Instead, we will use a reverse proxy like HAProxy in front of our services which can collect metrics on our behalf.
The reverse proxy plays two roles, it exposes our apps to the outside world, and it collects metrics while it’s at it.
Unfortunately, HAProxy doesn’t export metrics in a Prometheus compatible format. Luckily the community has built an exporter which can do this for us.
We have a small problem with this setup.
HAproxy won’t capture metrics for direct service to service communication since that will bypass it altogether.
We can solve this loophole entirely by using something we call a service mesh. You can read more about it in this article.
Our Final Monitoring Setup
Our final monitoring setup using Prometheus and Grafana will look something like this:
Deploying our Monitoring Stack
Finally, it’s time to get our hands dirty.
To get our services up, we’ll write a docker-compose file. Docker-compose is an awesome way to describe all the containers we need in a single YAML file. Again, all the resources can be found in this GitHub repo.
version: '3'

services:
  ###############################################################
  #                Our core monitoring stack                    #
  ###############################################################
  prometheus:
    image: prom/prometheus
    ports:
    - 9090:9090                                       # Prometheus listens on port 9090
    volumes:
    - ./prometheus.yml:/etc/prometheus/prometheus.yml # We mount a custom prometheus config
                                                      # file to scrap cAdvisor and HAProxy
    deploy:
      resources:
        limits:
          cpus: '1'
          memory: 512M

  grafana:                                            # Garafana needs no config file since
    image: grafana/grafana                            # we configure it once it's up
    ports:
    - 3000:3000                                       # Grafana listens on port 3000
    depends_on: [prometheus]

  ###############################################################
  #            Agent to collect runtime metrics                 #
  ###############################################################
  cadvisor:
    image: google/cadvisor:latest
    container_name: cadvisor
    volumes:                                          # Don't ask me why I mounted all these
    - /:/rootfs:ro                                    # directories. I simply copied these
    - /var/run:/var/run:rw                            # mounts from the documentation.
    - /sys:/sys:ro
    - /var/lib/docker/:/var/lib/docker:ro
    deploy:
      resources:
        limits:
          cpus: '1'
          memory: 512M

  ###############################################################
  #                          HA proxy                           #
  ###############################################################
  haproxy:                                             # We are using HAProxy as our reverse
    image: haproxy:2.3                                 # proxy here
    ports:
    - 11000:11000                                      # I've configured HAProxy to run on 11000
    volumes:
    - ./haproxy.cfg:/usr/local/etc/haproxy/haproxy.cfg # We mount a custom config file to proxy
    deploy:                                            # between both the services
      resources:
        limits:
          cpus: '0.5'
          memory: 512M
    depends_on: [svc-greeter, svc-math]

  haproxy-exporter:
    image: prom/haproxy-exporter                       # Need to point the exporter to haproxy
    command: '--haproxy.scrape-uri="http://haproxy:8404/stats;csv"'
    depends_on: [haproxy]

  ###############################################################
  #                       Our Microservices                     #
  ###############################################################
  svc-greeter:                                         # These are our services. Nothing fancy
    image: spaceuptech/greeter
    deploy:
      resources:
        limits:
          cpus: '0.05'
          memory: 512M

  svc-math:
    image: spaceuptech/basic-service
    deploy:
      resources:
        limits:
          cpus: '0.05'
          memory: 512M
I have also gone ahead to make custom config files for Prometheus and HAProxy.
For Prometheus, we are setting up scrapping jobs for cAdvisor and HAProxy exporter. All we need to do is to give Prometheus the host and port of the targets. If not provided explicitly, Prometheus fires HTTP requests on the /metrics endpoint to retreive metrics.
For HAProxy, we configure one backend for each service. We will be splitting traffic between the two microservices based on the incoming request’s url. We’ll forward the request to the greeter service if the url begins with /greeting. Otherwise, we forward the request to the math service.
Bringing our services online
Now that we have described all our services in a single docker-compose file, we can copy all of this on our VM, ssh into it and then run docker-compose -p monitoring up -d.
That’s it.
Docker will get everything up and running.
These are the ports all the exposed services will be listening on. Make sure these ports are accessible.
| Service | Port |
|---|---|
| Prometheus | 9090 |
| Grafana | 3000 |
| HAProxy | 11000 |
We can check if Prometheus was configured correctly by visiting http://YOUR_IP:9090/targets. Both the targets (cAdvisor and HAProxy exported) should be healthy.
We can check if our proxy is configured properly by opening the following urls:
| Service | URL | Expected Response |
|---|---|---|
| Math Service | http://YOUR_IP:11000/add/1/2 |
{ "value": 3 } |
| Greeter Service | http://YOUR_IP:11000/greeting/YourTechBud |
{ "greeting": "hello YourTechBud" } |
Setting up our Monitoring Dashboard
Then the last step remaining would be to configure Grafana.
Visit http://YOUR_IP:3000 to open up Grafana. The default username and password will be admin.
Add Prometheus as a data source
All our monitoring metrics are being scrapped and stored in Prometheus. Hence, the first step is to add Prometheus as a datastore.
To do that, Hit Add a datasource > Select Prometheus from the dropdown > Enter http://prometheus:9090 as the Prometheus url > Hit Save & Test.
That’s all we need to do to link Grafana with Prometheus.
Create our dashboard.
Creating a dashboard from scratch can take time. You can import the dashboard I’ve already made to speed things up.
After hitting the Import Dashboard button in the Manage Dashboards section, simply copy and paste the JSON in the text area and select Prometheus as the data source.
That’s it.
Feel free to refer to this 10 minute video if you get lost.
Wrapping Up
You’ve just setup monitoring using Prometheus and Grafana.
You can edit a chart to see what I’ve done. You’ll see that all it takes to populate a chart is a Prometheus query.
Here’s one query as an example: sum(container_memory_usage_bytes{name=~\"monitoring_svc.*\"} / 1024 / 1024) by (name). This query calculates the total memory being consumed by our two microservices.
I agree that the Prometheus queries can be a bit overwhelming. But that doesn’t really matter. You can simply import this dashboard and expect it to just work.
Use it as a boilerplate. Mess around with it. Enjoy!
Did this article help you? How do you make sure your apps are cloud-native? Share your experiences below.